
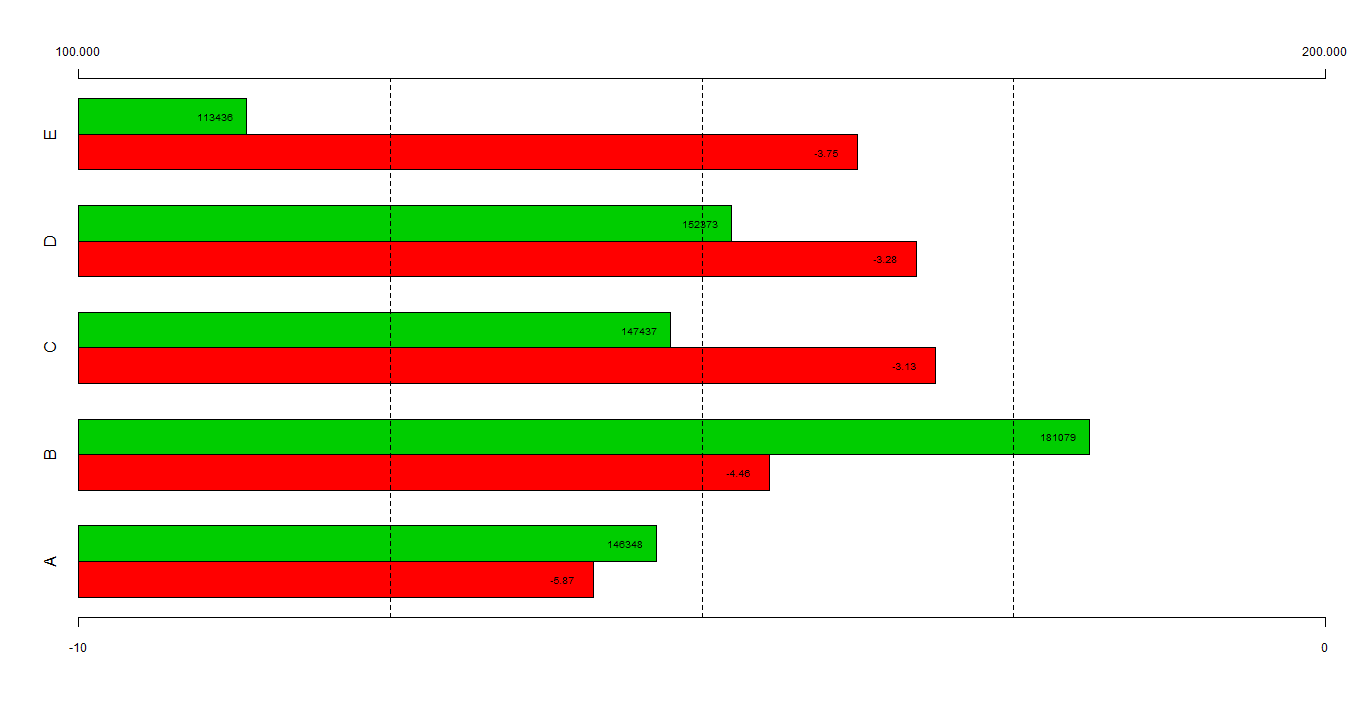
Olá, novamente! Mudei o código anterior, porque tinha um problema conceitual acerca do máximo e mínimos considerados. ### <code r> aRange <- c(-10,0) bRange <- c(100000,200000) set.seed(765) a <- runif(5, -10, -1) b <- runif(5, 110000, 200000) a1 <- t(scale(a-aRange[1], center=F, scale=diff(aRange))) b1 <- t(scale(b-bRange[1], center=F, scale=diff(bRange))) plot1 <- barplot(rbind(a1, b1), col=c(2,3), horiz=T, beside=T, xlim=c(0,1), names.arg=LETTERS[1:5], axes=F) axis(1, cex.axis=.75, seq(0,1,len=2), c(-10,0)) axis(3, cex.axis=.75, seq(0,1,len=2), c("100.000", "200.000")) abline(v=c(.25,.5,.75), lty=2) text(x=a1-.025, y=plot1[1,], labels=round(a,2), cex=.6, col=1, xpd=TRUE) text(x=b1-.025, y=plot1[2,], labels=round(b), cex=.6, col=1, xpd=TRUE) ### </code> [image: Imagem inline 1]